
Understand your chart
Fair value gaps: identify the range and its limits
Work through bullish and bearish three-candle gap examples, Core display controls, and the timing limits of higher-timeframe FVGs.
A fair value gap, or FVG, is a three-candle price pattern in which the first and third candles leave a non-overlapping range after a directional move. The term does not establish an asset's fair value. A marked gap also does not prove that price must revisit it.
A bullish example with numbers#
Take three consecutive candles named A, B, and C. In this educational example, A has a high of 100, B moves upward, and C has a low of 103. The first and third candles leave a range between 100 and 103. Its width is 3 price units and its midpoint is 101.5.
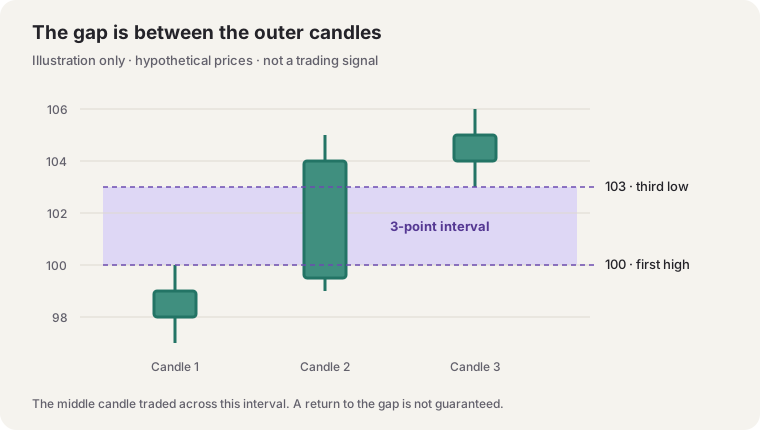
That describes the basic bullish geometry. The illustration is a schematic, not a live chart or backtest. It does not prove that no trading occurred inside the range during the middle candle. A later low of 102 enters part of the range. Reaching 100 traverses the full range. Neither outcome is inevitable. A box's midpoint is a drawing reference, not evidence of a likely turning price.
For a bearish example, A has a low of 110 and C has a high of 107 after a downward move. The non-overlapping range lies between 107 and 110. These invented values explain the pattern only; they are not a setup recommendation.
How Core displays gaps#
Fair Value Gaps is off by default in the Core source covered here. Enable it in settings to inspect this module. Auto Threshold applies an additional filter, so a three-candle pattern you identify manually may not produce a box. The detection also considers the intervening candle's movement; geometry alone is not a complete statement of its condition.
Timeframe selects the data interval for gap detection. A blank selection uses the chart timeframe. Extend FVG controls how far the box is drawn horizontally. Extending a box does not increase its significance or guarantee that the range stays relevant for that many bars.
A gap touch and removal are different#
Price can enter a box without crossing its far boundary. In the reviewed Core source, a bullish gap is removed after price moves below its lower boundary. Bearish removal has a different implementation: it tests whether price moves above the stored lower boundary, so a bearish box can disappear before price traverses the full gap. For the hypothetical 107–110 bearish range, removal can occur above 107 rather than requiring a move above 110. Do not treat disappearance as proof of a full fill. This is a source-level caveat, not a verified observation of every installed customer version or a claim that the Pine code has been corrected. Record the price reached and your definition of partial or full traversal.
Higher-timeframe timing needs separate verification#
On a lower-timeframe chart, a gap from a higher interval is not automatically confirmed when the chart candle closes. The higher candle may still be forming. The reviewed Core gap implementation also has a historical lookahead caveat; historical appearance alone cannot establish when its higher-timeframe box was available live.
TradingView explains the relevant distinction in other timeframes and data. Before evaluating an MTF gap, capture its first live appearance, the requested interval's closing time, and its state after reloading. Read repainting and confirmation for the full check. Until those observations agree, treat availability timing as unverified.